80% of alerts are noise that wastes engineering time
SRE teams spend hours triaging false positives instead of solving real problems that impact customers
-2.svg)
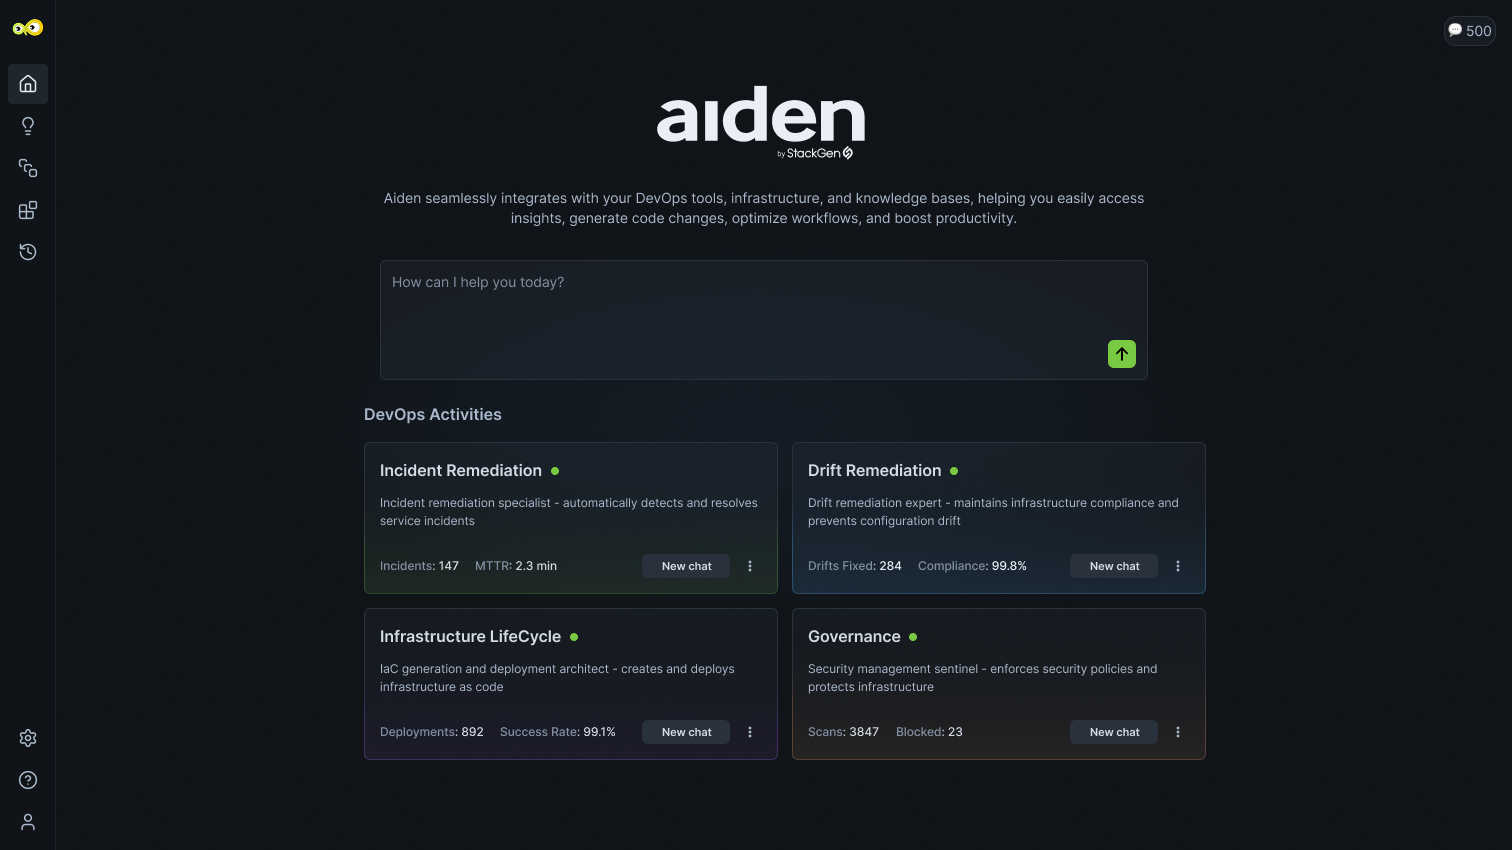
Aiden for
SRE
 Error
ErrorWhich service is contributing most to the increased error rate?
Predictive Downtime Analysis
Based on previous log, traces, metrics, and alerts, identify...
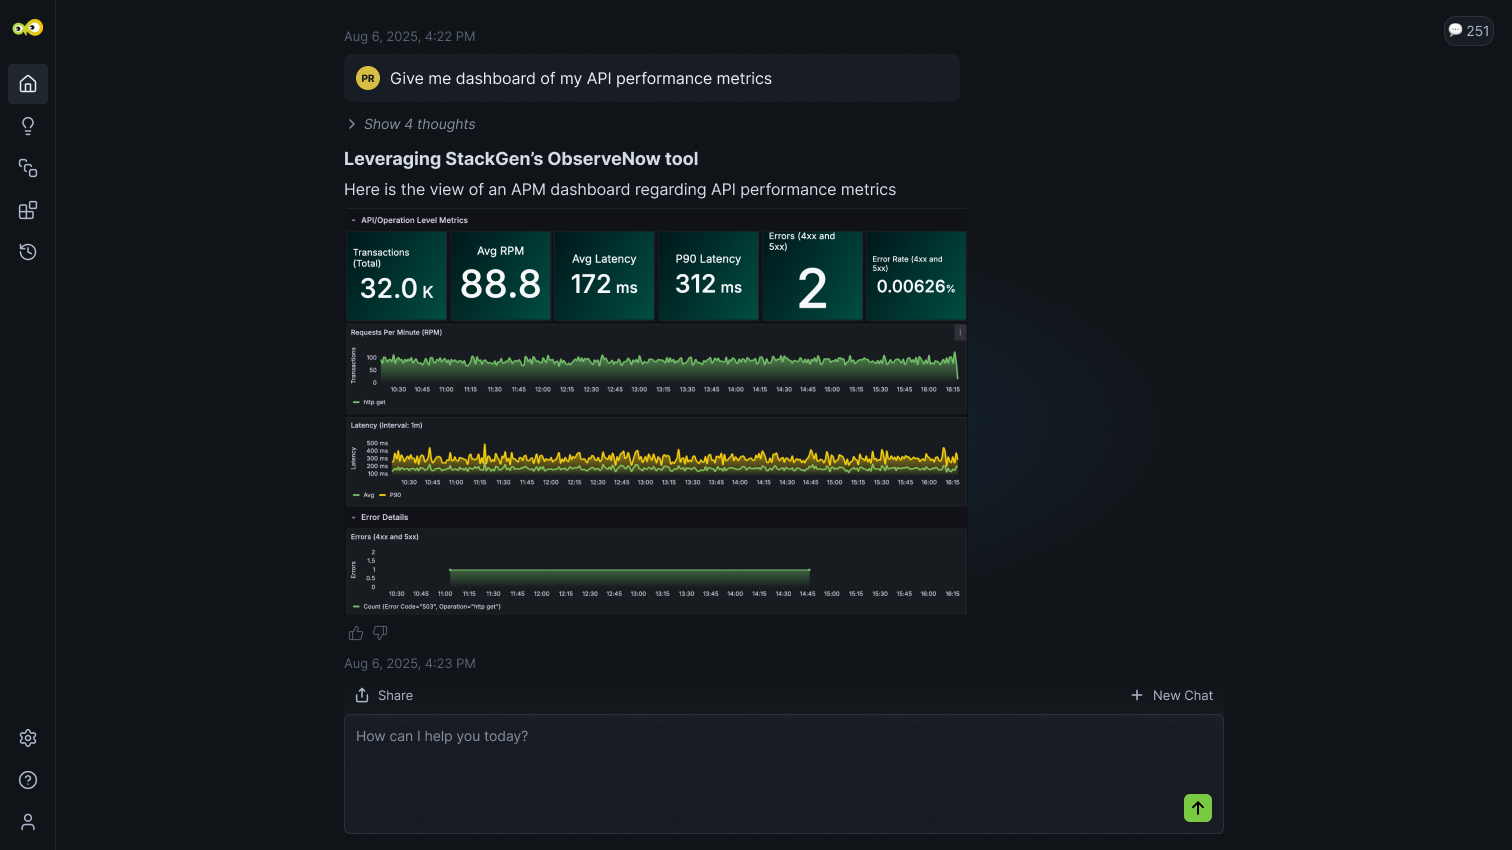
Return Health Status Insights With Grafana
Return the health status on the payment service and related Grafana alerts and dashboards.
Grafana Alert Analysis
Analyzes Grafana alerts to identify patterns, correlate incidents across Prometheus, Loki,...


.svg?width=120)


SRE teams spend hours triaging false positives instead of solving real problems that impact customers
Correlating logs, metrics, and traces across services requires manual effort and deep tribal knowledge.
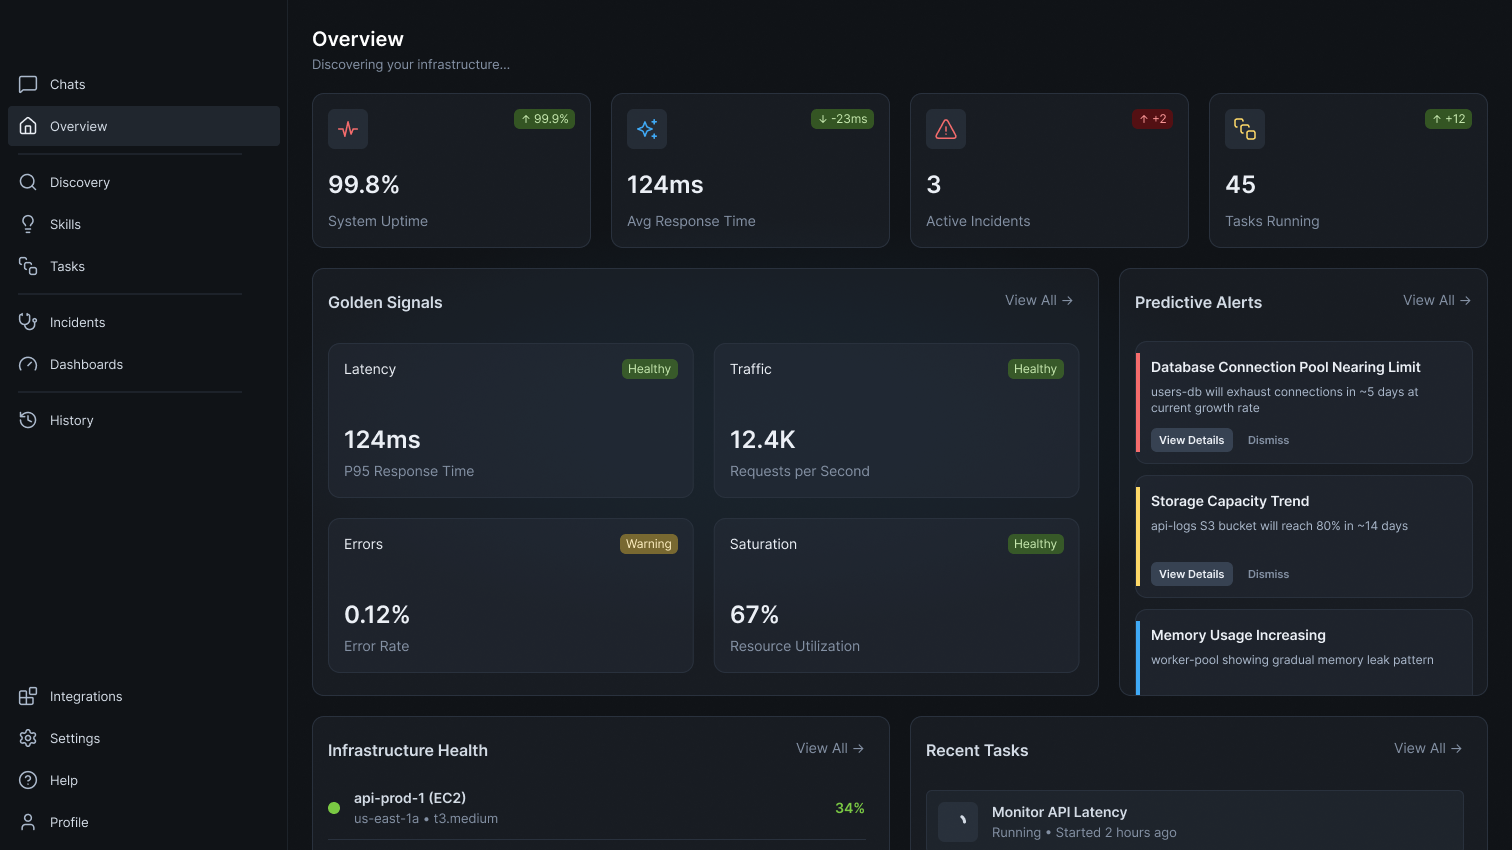
Without proactive detection, teams discover issues only after users are already impacted.
Auto-discover infrastructure, filter alert noise, and accelerate root cause analysis with AI that learns your environment—keeping humans in control of critical decisions that impact SLO
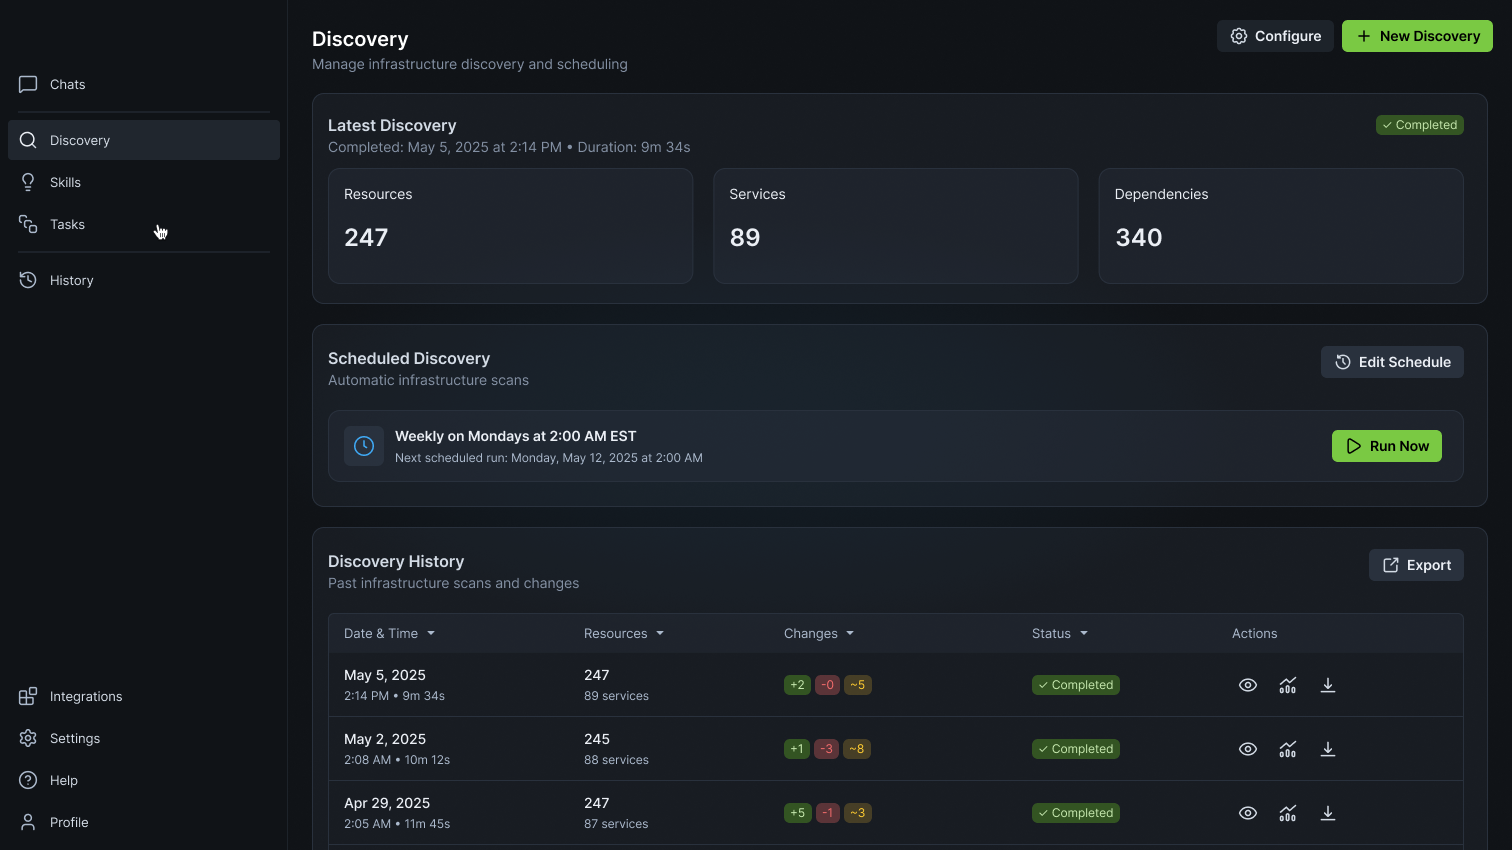
Auto-discover infrastructure, services, and dependencies from your existing observability stack—no manual mapping required.
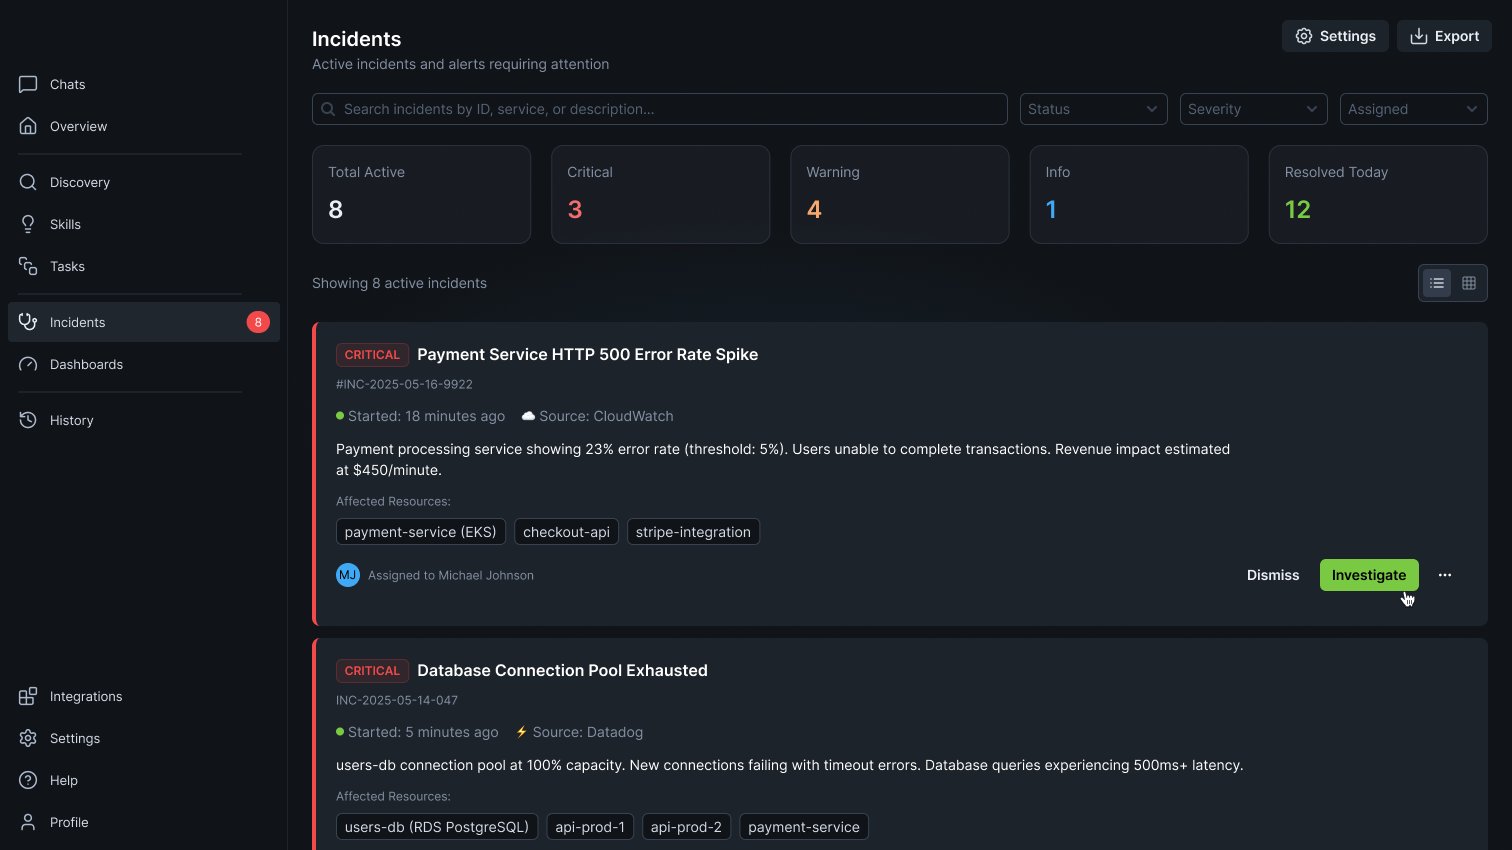
Cut through alert noise with automated correlation, deduplication, and severity classification by blast radius.
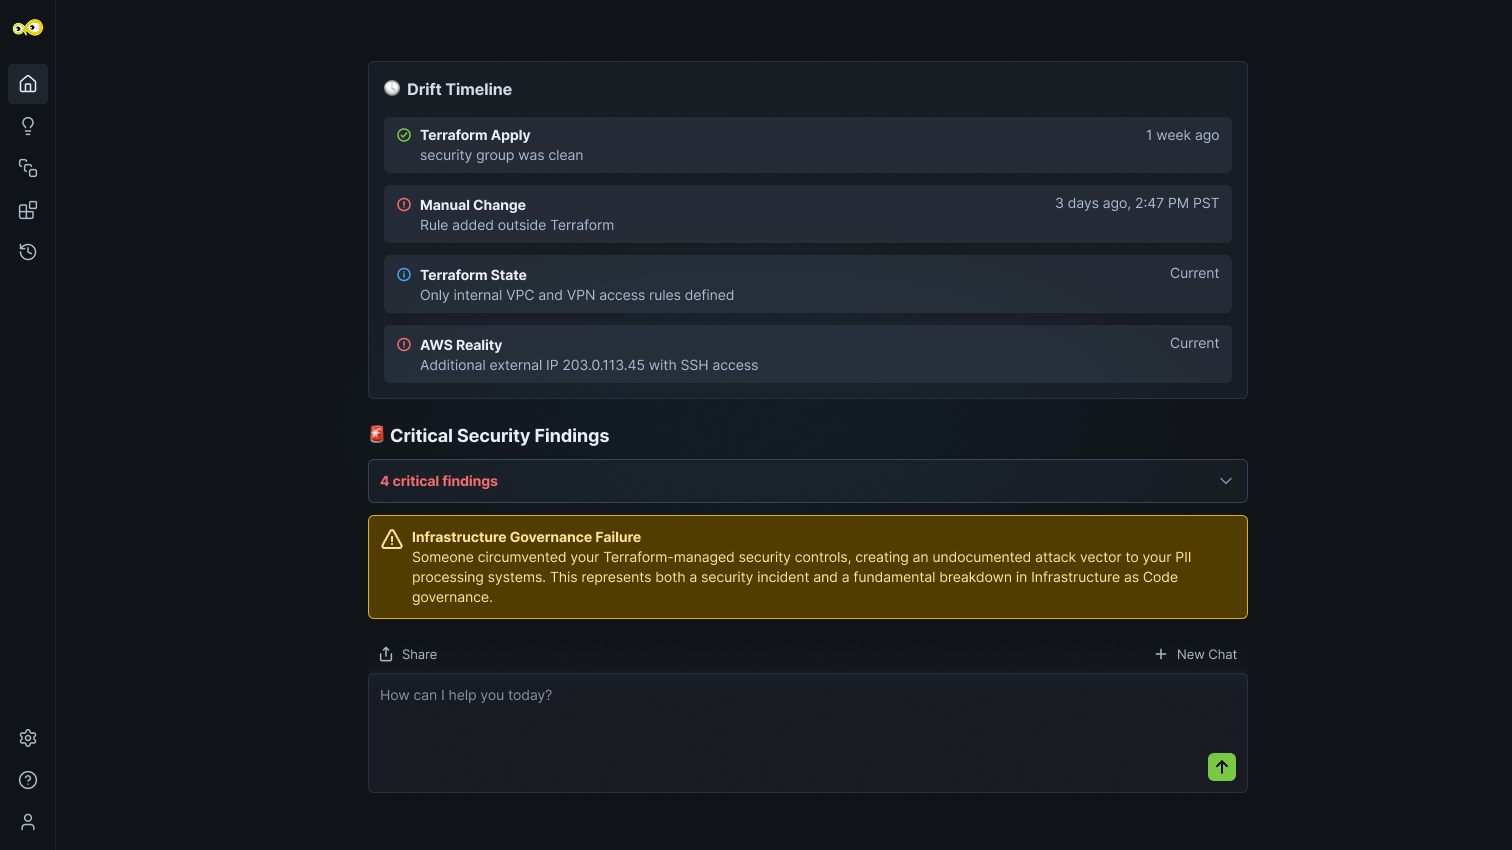
Trace incidents across service dependencies and correlate logs, metrics, and events to identify probable causes fast.
Execute remediation workflows for common scenarios with full audit trails and human approval for every action.
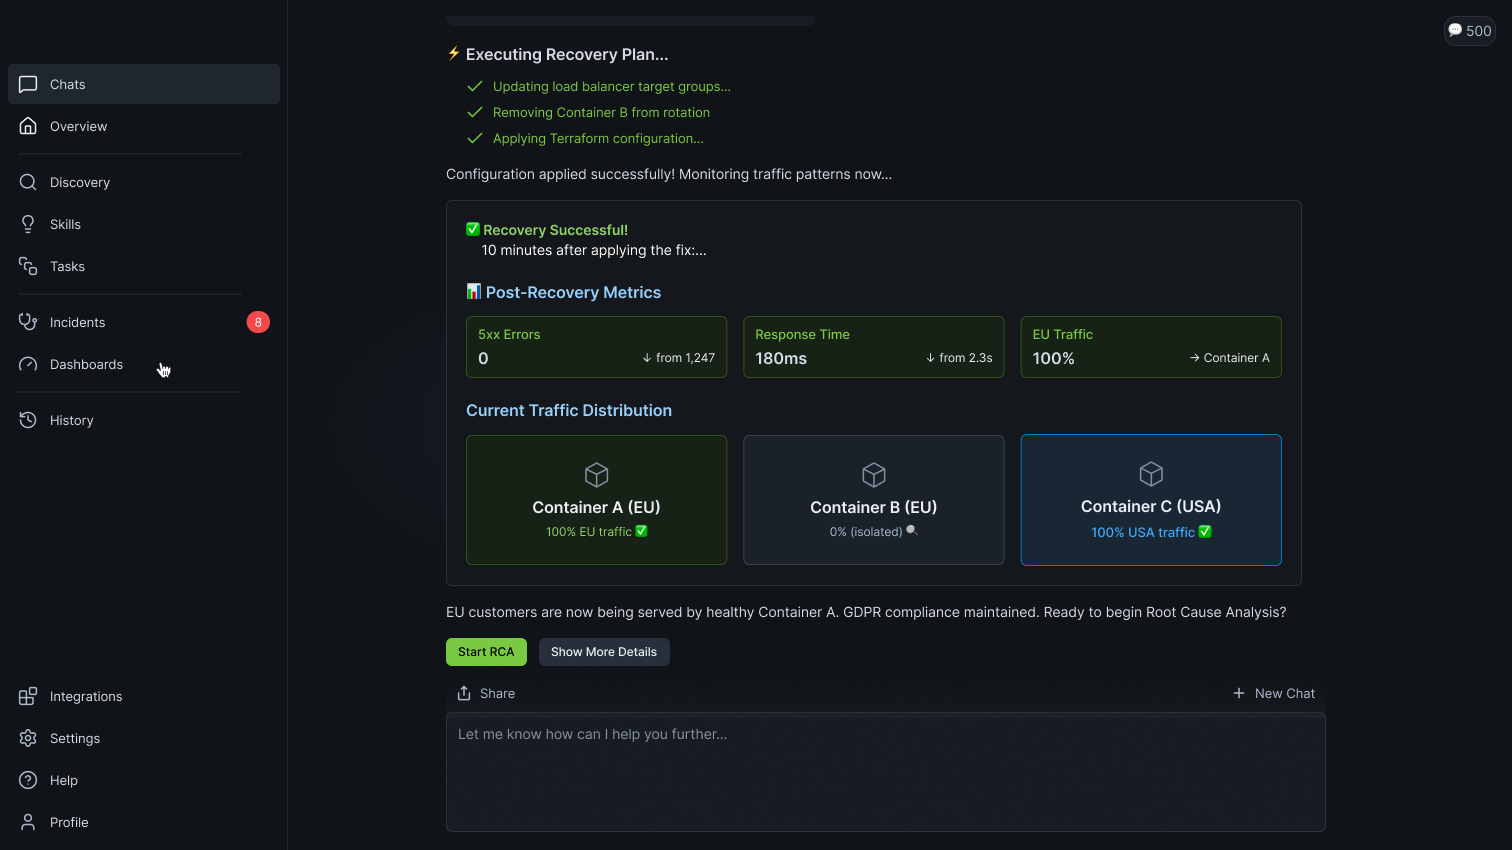
Track error budget consumption in real-time and prioritize incidents by SLO impact, not just alert severity.
 Automatically discovers existing infrastructure
Maps your services, dependencies, and topology from Grafana, Prometheus, and cloud providers—no manual cataloging required.
.png)
 Triages alerts by filtering false positives
Correlates related alerts, suppresses known noise patterns, and surfaces only the signals that matter to your on-call team.
 Prioritize incidents against SLO Goals
Ranks incidents by error budget impact so your team focuses on what threatens reliability, not just what's loudest.
 Creates actionable Root Cause Analysis
Traces issues across service dependencies, correlates logs and metrics, and identifies probable causes with supporting evidence.
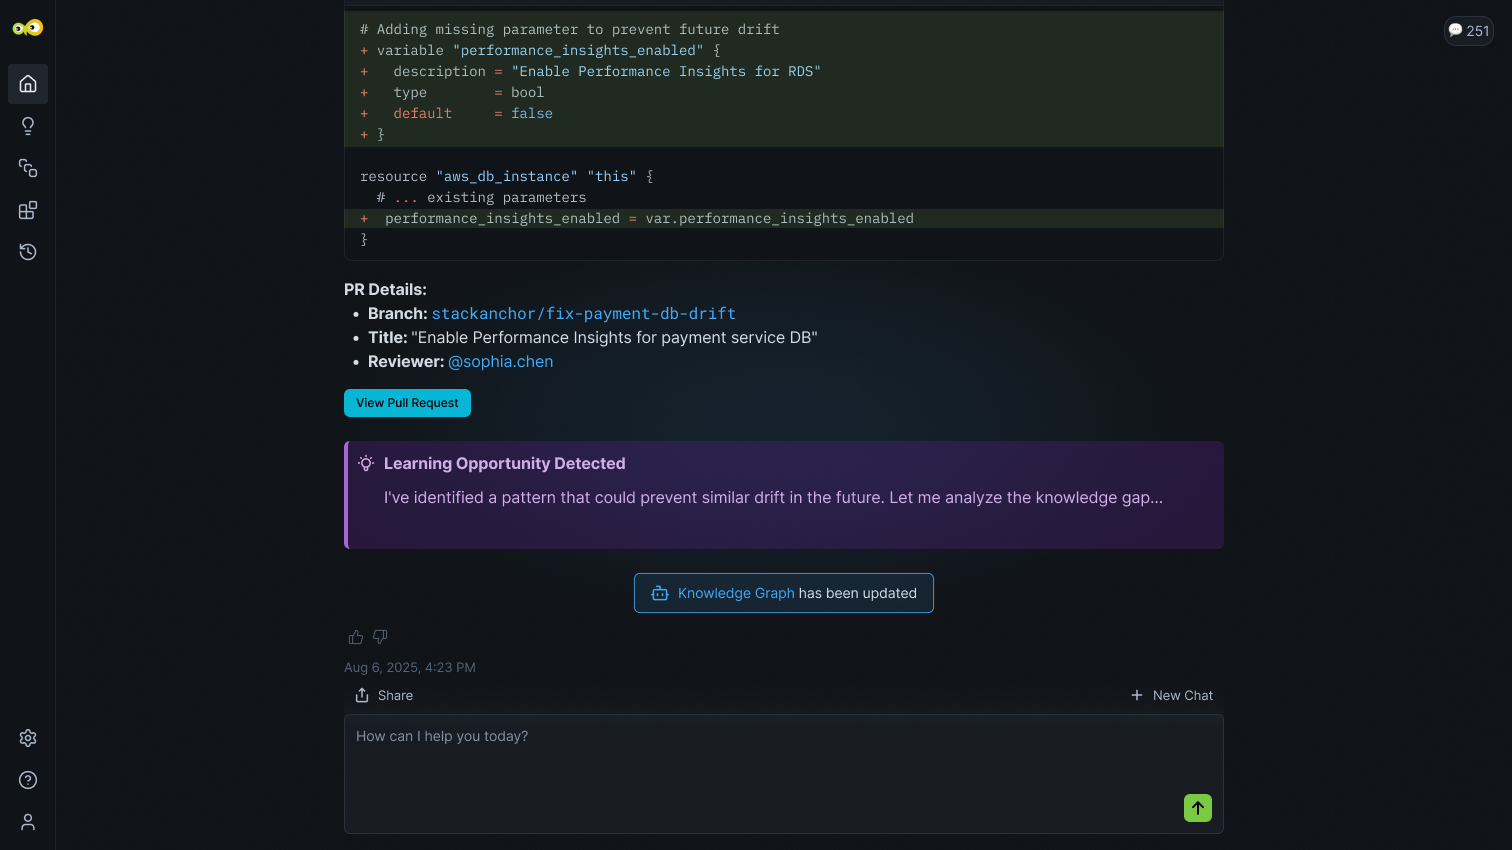
Suggests proven fixes from 50+ pre-built workflows while keeping engineers in control—every action requires explicit approval.