70-80% of alerts require manual investigation, overwhelming on-call engineers and delaying critical issue resolution across your observability stack.
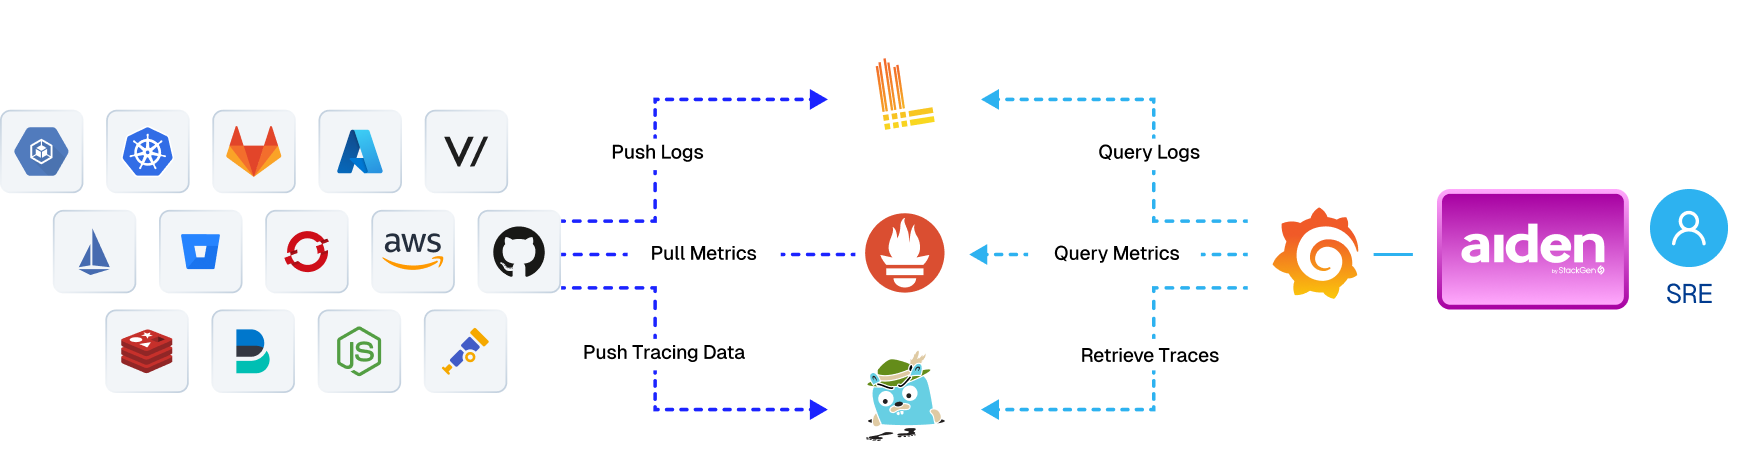
Slow Root Cause Analysis
Engineers spend 3-4 hours manually correlating metrics, logs, and traces across Grafana dashboards to identify the source of production incidents.
Observability Data Overload
Massive telemetry from distributed systems creates cognitive overload, with teams spending 65% of their time on manual data investigation.
Who is this for?
Site Reliability Engineer (SRE)
Goal
Reduce MTTR and prevent incidents from escalating into major outages that impact customer experience.
Challenge
Team drowning in alert noise and spending 65% of time on manual investigation instead of strategic improvements.
StackGen Solution
Instant automated reporting and 90% faster incident detection delivers quantifiable improvements in team productivity.
Solution
Elevate Your Open-Source O11y Stack
Aiden is the intelligent layer your open-source observability stack has been missing. We transform your existing Grafana, Loki, Prometheus and Jaeger infrastructure from a data collection system to a proactive, intelligent operations platform with a natural language interface.
Data Control & Intelligent Alert Enrichment
"Analyze firing alerts and provide recommended actions"
Metrics Analysis
"Show me CPU usage trends for payment service over the last 24 hours"
Log Investigation
"Find error patterns in authentication service logs from last week"
Automated Reporting
"Generate a weekly performance report for production services"
Benefits
Reduce MTTR By 50%
Reduce MTTR from hours to under 30 minutes - 50% faster root cause identification through AI-powered correlation of metrics, logs, and traces.
Cut Alert Noise by 90%
Automatically enrich and triage alerts with context, root cause analysis, and remediation steps - eliminating 70-80% of manual investigation time.
Compress Detection Time by 90%
Detect issues in under 5 minutes vs 45-60 minutes manually - reducing MTTD by 90% with predictive analysis and intelligent monitoring.
Reduce Operational Overhead by 75%
Automate reporting and eliminate 10-15 hours/week of manual insights generation with instant, comprehensive observability reporting.
Frequently Asked Questions
How does Aiden enhance my existing Grafana setup?
Aiden acts as an intelligent layer on top of your Grafana observability stack, transforming it from a data visualization tool into a proactive operations platform. Instead of manually writing PromQL queries or navigating dashboards, you can ask questions in plain English like "Show me CPU usage trends for the payment service over the last 24 hours" or "What error logs correlate with the latency spike at 3 PM yesterday?" Aiden automatically queries your Grafana datasources (Prometheus, Loki), analyzes the data, and provides actionable insights—reducing investigation time from hours to minutes.
What Grafana datasources does Aiden support?
Aiden currently integrates with Prometheus (for metrics) and Loki (for logs), the two most widely used datasources in Grafana deployments. This means Aiden can help you correlate metrics and logs across your entire observability stack, perform root cause analysis, analyze firing alerts, and investigate performance issues—all through natural language queries. Additional datasource support is planned for future updates.
Do I need to replace my Grafana setup to use Aiden?
No. Aiden is designed to work seamlessly with your existing Grafana infrastructure—no rip-and-replace required. You simply connect Aiden to your Grafana instance using an API token, and it immediately starts enhancing your observability workflows. Your dashboards, alerts, and existing configurations remain unchanged. Aiden complements Grafana by adding AI-powered querying, automated root cause analysis, and intelligent alert triage on top of your current setup.
How does Aiden help reduce Mean Time to Resolution (MTTR)?
Aiden accelerates incident resolution in three key ways:
Intelligent Alert Triage: Automatically enriches alerts with relevant context, potential root causes, and recommended next steps—eliminating manual investigation overhead.
Natural Language Investigation: Query logs and metrics across services without writing complex PromQL or LogQL queries, enabling faster correlation and diagnosis.
Automated Root Cause Analysis: Aiden proactively analyzes metrics, logs, and firing alerts to identify the source of issues, often before they escalate—reducing MTTR from hours to minutes.
Organizations using Aiden report MTTR reductions of up to 80% compared to manual Grafana workflows.
What permissions does Aiden need to access my Grafana instance?
Aiden requires a Grafana API token with Editor permissions to query datasources and access the Explore feature. We recommend creating a dedicated service account specifically for Aiden with the minimum required permissions. For security best practices:
Use a service account token rather than a personal access token
Regularly rotate API keys (every 60-90 days)
Enable audit logging in Grafana to monitor Aiden's activities
Restrict token scope to only the datasources Aiden needs to access