Skip to content
Grafana Loki Aiden Prometheus

Supercharge Your Open Source Observability: Aiden with Grafana, Prometheus, Loki, and Jaeger

Author:
Alex Cho | Nov 27, 2025
Supercharge Your Open Source Observability: Aiden with Grafana, Prometheus, Loki, and Jaeger
Topics

Share This:

The Open Source Observability Investment

Enterprise teams have made substantial investments in open source observability tools like Grafana, Loki, Jaeger, and Prometheus. And for good reason: these tools provide complete control over your monitoring infrastructure and data, with no vendor lock-in. Many organizations complement their OSS stack with commercial tools for specific needs like APM or advanced tracing, but the foundation remains open source.


The challenge? While these tools generate valuable telemetry data, extracting actionable insights still requires significant manual effort. SRE teams spend hours correlating metrics, logs, and traces across multiple interfaces. Developers avoid the complexity altogether. The data is there, but getting to answers takes too long.


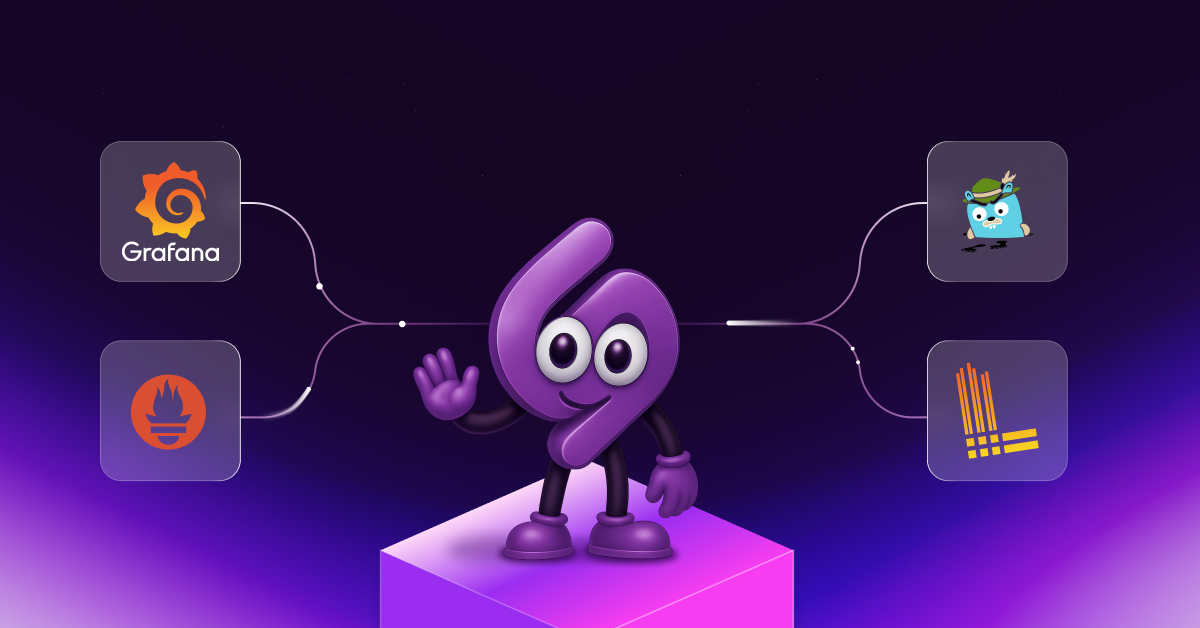
Aiden adds an intelligent layer on top of your existing observability stack, transforming how your team detects, diagnoses, and resolves issues without replacing anything you've built.


Minutes to Value, Not Months

Integration is straightforward. Connect Aiden to your Grafana instance, and it automatically discovers your Prometheus, Loki, and Jaeger data sources. No agents to deploy, no data pipelines to rebuild, no changes to your existing setup. Teams are typically up and running in under 10 minutes.


Once connected, Aiden immediately begins analyzing your telemetry data, understanding your system topology, and learning normal behavior patterns. Your investment in open source observability is preserved and enhanced, not replaced.


Slashing MTTR and MTTD

When incidents occur, manual correlation across tools is the bottleneck. An engineer checks Prometheus for metric spikes, searches Loki logs for errors, examines Jaeger traces for request flows, and switches between Grafana dashboards trying to piece it together.


Aiden does this correlation automatically. When latency increases for a critical service, Aiden instantly connects elevated response times in Prometheus with specific error patterns in Loki logs and problematic service calls in Jaeger traces. What takes 30 minutes manually happens in seconds.


Enterprise customers report 60-80% reductions in MTTR and detect issues 4x faster on average. The data you already have becomes immediately actionable.


Automated SRE Tasks

SRE teams spend significant time on repetitive investigation and operational tasks. Aiden automates these workflows by leveraging your observability data and integrating with your broader infrastructure:


Suggests rollback candidates when deployments correlate with increased errors. Performs cost analysis of your cloud accounts to identify optimization opportunities. Generates quick security reports highlighting potential vulnerabilities. Identifies underutilized resources across your infrastructure. Generates incident timelines by correlating events across all your tools. Creates comprehensive root cause analysis (RCA) documents. Produces detailed postmortem reports with timeline, impact, and lessons learned.


This automation reduces toil, allowing SRE teams to focus on reliability engineering rather than manual correlation and repetitive reporting. Teams report 50-60% reduction in time spent on toil activities.


Correlation Across Your Entire Stack

Modern enterprises don't operate with observability tools in isolation. Your infrastructure spans multiple systems: observability stacks, source control, deployment pipelines, and more. Aiden correlates data across all of these:


Observability Tools: Grafana, Prometheus, Loki, Jaeger, and commercial APM solutions. Development Workflow: GitHub for code changes, pull requests, and commit history. Deployment Systems: ArgoCD, Jenkins, and other CI/CD tools. Cloud Infrastructure: AWS, GCP, Azure resource metrics and configurations.


When investigating an incident, Aiden automatically connects the dots between a spike in errors, a recent deployment in ArgoCD, specific code changes in GitHub, and corresponding resource utilization in your cloud account. This cross-system correlation eliminates the manual work of switching between tools and piecing together the timeline.


grafana

Skills


Pre-built Skills: Aiden includes ready-to-use capabilities for common SRE and DevOps tasks including incident investigation, performance analysis, cost optimization, security assessments, and deployment correlation.


aiden_skills

Knowledge Base

Aiden comes equipped with extensive built-in knowledge and continuously learns from your environment:


Custom Knowledge Base: Organizations can extend Aiden with company-specific knowledge such as runbooks and standard operating procedures, architecture documentation, compliance requirements, escalation procedures, and historical incident patterns and resolutions.


Continuous Learning: As Aiden works with your environment, it builds understanding of your service dependencies, normal behavior patterns for your specific workloads, common failure modes and their resolutions, and team preferences for incident handling.


This combination of general expertise and environment-specific learning means Aiden becomes more valuable over time, adapting to your organization's unique needs while maintaining best practices across the industry.


aiden_knowledge_hub

Intelligence for Complex Systems

Modern distributed systems generate overwhelming telemetry volumes. Aiden applies advanced analysis to extract meaningful patterns from this complexity, understanding service dependencies and recognizing anomalous behavior even when individual metrics remain within normal ranges.


For example, Aiden might notice slightly elevated latency in Prometheus, increased retry behavior in Jaeger traces, and a small uptick in specific warnings in Loki logs. Individually, none trigger alerts, but together they indicate a degrading database connection pool. Aiden surfaces this pattern before it escalates into an outage, enabling proactive intervention.


Preserving Your Open Source Investment

Many enterprises choose open source observability specifically to avoid vendor lock-in and maintain control over their monitoring infrastructure and data. Aiden respects this choice by enhancing rather than replacing your OSS stack.


Your Grafana dashboards remain unchanged. Your Prometheus recording rules continue working. Your log parsing in Loki stays the same. Jaeger provides the same distributed tracing visibility. The difference is that Aiden adds an intelligent layer that makes all of these tools more effective without introducing dependency or lock-in.


You continue to own your data, control your infrastructure, and use the open source tools you trust. Aiden simply makes them work better together.


Getting Started

Connect Aiden to your Grafana instance through the standard API. Aiden automatically discovers and connects to your Prometheus, Loki, and Jaeger data sources. Configure authentication following your security policies. Start seeing enriched alerts and automated insights within the first hour.


To integrate Grafana, do the following:

Instructions

1. Obtain your Grafana API key

  1. You need to be an Admin in Grafana.
  2. Go to the Users and access section under the Administration section.
  3. Go to the Service accounts section.

    grafana1
  4. Click on the Add Service Account button and follow the on-screen instructions to create a Service Account.
  5. Create a Service Account Token by clicking on the Add Service Account Token button and follow the on-screen instructions.

    grafana2

2. Configure the integration in Aiden

  1. Navigate to Integrations in the sidebar.
  2. Find the Grafana integration card and click Activate.
  3. Configure your Grafana access:
    • Grafana URL : Your Grafana instance URL
    • API Key : A Grafana API key with appropriate permissions
  4. Click Save to enable the integration.
Your SRE and DevOps teams can evaluate Aiden's impact immediately on real incidents and routine operations, without disrupting existing workflows or requiring extensive training.


Once integrated, users can start asking business questions or questions based on symptoms like the following:


  • Show me CPU usage trends for the payment service over the last 24 hours
  • What error logs correlate with the latency spike at 3 PM yesterday?
  • Compare memory usage between production and staging environments
  • Are there any services showing abnormal error rates?
  • Find all error logs from the authentication service during the last incident
  • Which services have the highest request latency right now?
  • Create a report of resource utilization trends for all production services
  • Tech store orders are failing. Find out why
  • Analyze the resource usage of pods in prod and provide recommendation for right-sizing

The Bottom Line

Enterprises have built comprehensive observability stacks with open source tools that provide control, flexibility, and no vendor lock-in. The challenge has always been turning telemetry data into timely insights.


Aiden bridges this gap by adding an intelligent layer to your existing stack—delivering faster incident detection, dramatically reduced resolution times, a natural language interface that improves developer adoption, and automation that reduces SRE toil. All achieved in minutes, working with the open source tools you've already deployed.


Your systems are complex. Your observability data is vast. Aiden makes both manageable, helping your team maintain reliability at scale while preserving your investment in open source infrastructure.


About StackGen:

StackGen is the pioneer in Agentic Infrastructure Platform (AIP) technology, helping enterprises transition from manual Infrastructure-as-Code (IaC) management to fully autonomous operations.
Founded by infrastructure automation experts and headquartered in the San Francisco Bay Area, StackGen serves leading companies across technology, financial services, manufacturing, and entertainment industries.