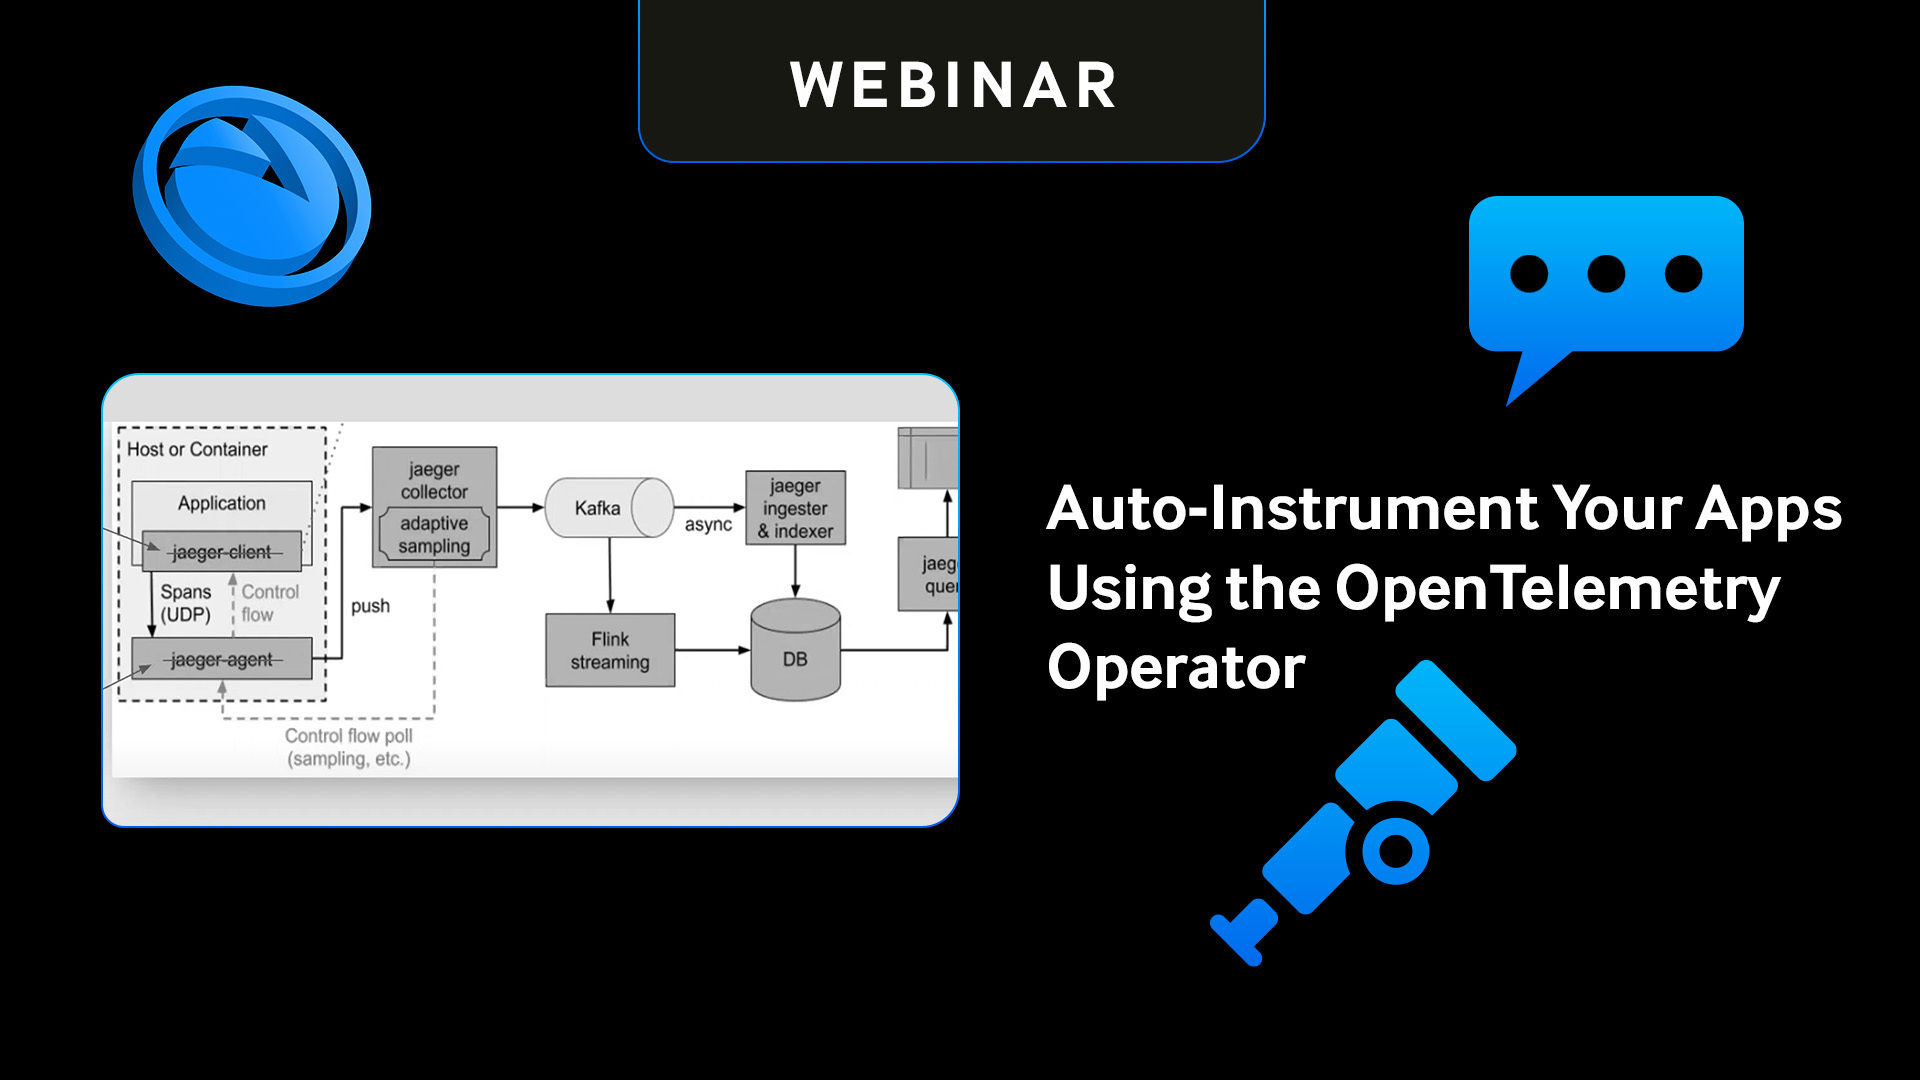
Instrumenting your apps to emit traces make them highly observable. Before the OpenTelemetry Operator for Kubernetes, we achieved quasi-auto instrumentation by pulling in client libraries for our specific programming languages into our code.
This webinar will demonstrate how the OpenTelemetry Operator enables auto-instrumentation of the app - without manually changing the code!
We will start by deploying a simple NodeJS app into Kubernetes along with a database (Python, Java, and .NET will work exactly the same). Then, by adding specific annotations to the pod, we'll show the app get automatically instrumented to emit traces.
We'll then interact with the app to see traces being sent to the OpenTelemetry Collector, which make their way to Jaeger (or whichever tracing system you have) for rich insights into your distributed system!
CTA: Get started | Ready to experience the future of DevOps? | Start For Free