

Share This:
Introduction
Your Lambda function performs flawlessly under load tests. Then it hits production — and every few minutes, a subset of users receives a response that's 3–5 seconds slower than the rest. Support tickets start appearing. Your on-call SRE opens CloudWatch, spots Init Duration entries scattered across log lines, and begins manually correlating timestamps across a dozen invocations. Meanwhile, your P99 latency SLO is silently breaching.
The hidden cost adds up. A senior SRE spending 4 hours per week diagnosing intermittent cold start regressions is $26,000 per year in toil — before you account for the downstream customer impact of latency spikes. Teams managing dozens of Lambda functions across multiple AWS accounts consistently rank cold start debugging as one of the top three sources of unplanned on-call work.
AWS Lambda cold starts are not bugs; they are a fundamental characteristic of how Lambda initializes execution environments. But they are measurable, traceable, and fixable, provided you have the right observability stack. In this guide, we'll walk through how to use Grafana to identify cold start patterns, visualize initialization latency, and isolate root causes so your SRE team spends less time grepping logs and more time improving reliability.
What Is a Lambda Cold Start?
When AWS Lambda receives a request, and no warm execution environment is available, it provisions a new one. This process, downloading your deployment package, initializing the runtime, and executing your initialization code, is what engineers call a cold start.
Cold starts inject Init Duration into your function's total execution time. Typical overhead ranges from 100ms to over 3 seconds, depending on:
- Runtime: JVM-based runtimes (Java, Kotlin) are significantly slower to initialize than Node.js or Python. A Java Lambda with Spring Boot can add 5–10 seconds. Node.js typically cold starts in 100–400ms.
- Package size: Lambda functions exceeding 50MB (compressed) commonly see an additional 500ms–1s of init time.
- VPC configuration: VPC-attached functions require ENI provisioning. Even with Hyperplane ENIs, under-provisioned subnet CIDR blocks silently delay initialization by 10–30 seconds.
- Memory allocation: Functions at 1,792MB get a full vCPU, which meaningfully accelerates initialization code execution. Higher memory is often the cheapest cold start mitigation.
- Initialization code complexity: Loading ML models, establishing DB connections, pulling secrets from AWS Secrets Manager, and initializing SDK clients in global scope executes on every cold start.
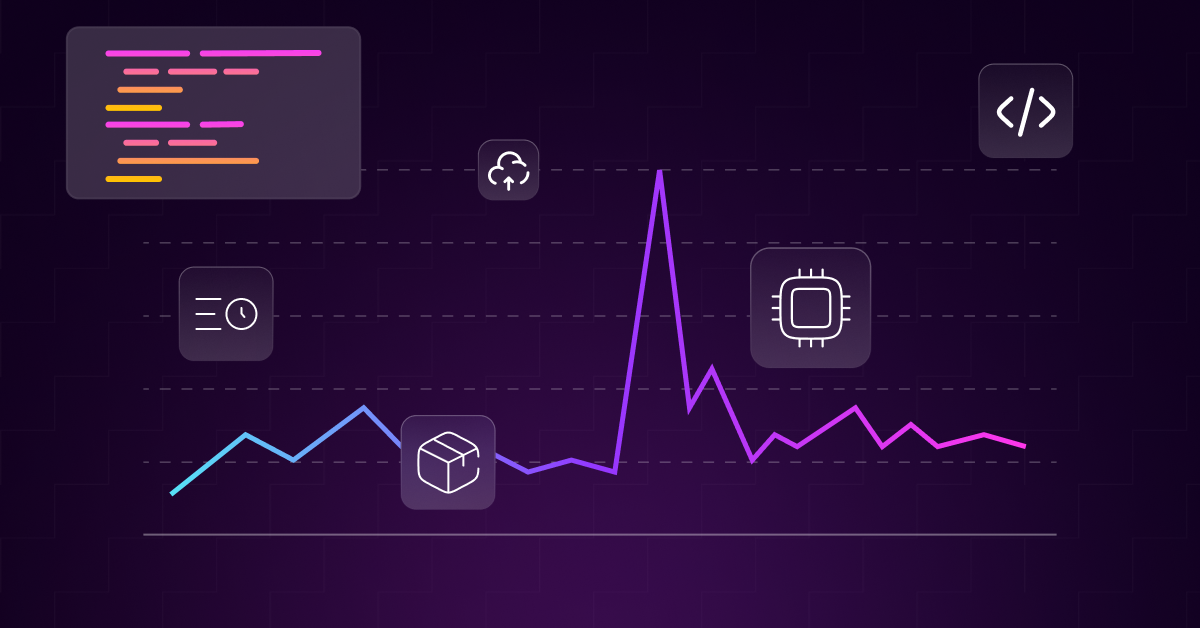
Cold starts are intermittent by nature — they spike after periods of inactivity, during traffic bursts, and after every deployment. This makes them impossible to debug from the last 10 log lines. You need to analyze patterns across thousands of invocations, correlated with deployment events, traffic curves, and configuration changes.
Why Grafana for Lambda Cold Start Debugging?
CloudWatch is the default choice, but the wrong tool for pattern-level analysis. Filtering Init Duration from raw log streams, hand-building metric filters, and assembling dashboards widget-by-widget is precisely the kind of operational toil that erodes SRE capacity, producing dashboards that nobody updates after the third sprint.
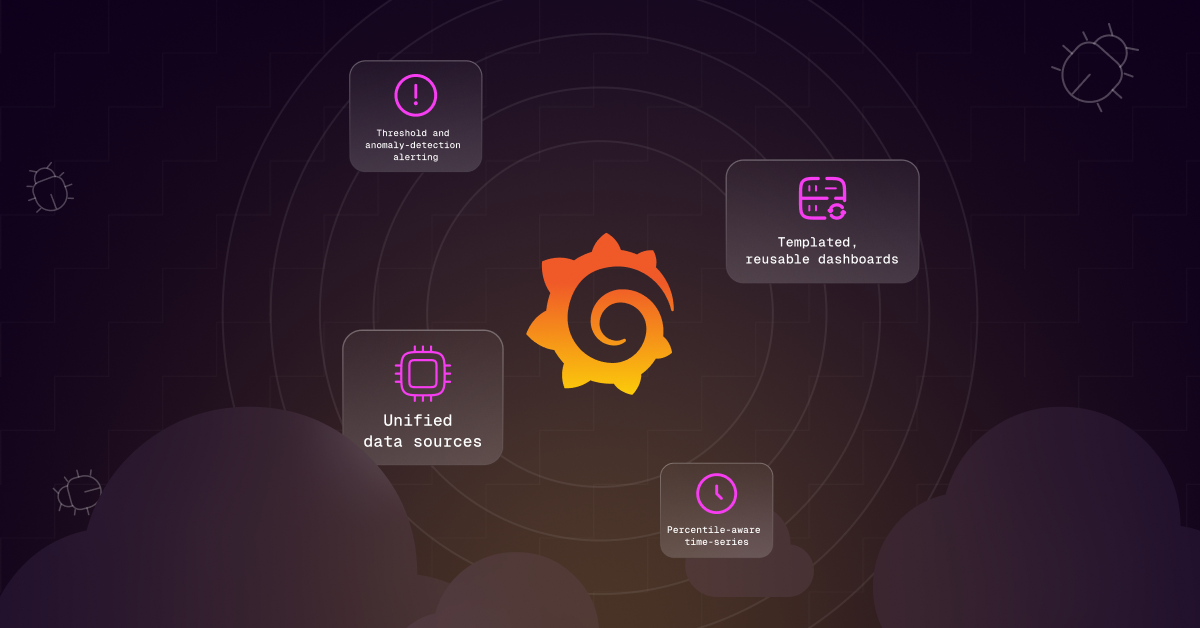
Grafana gives you:
- Unified data sources: Query CloudWatch Metrics, CloudWatch Logs Insights, X-Ray traces, and custom instrumentation side-by-side in a single dashboard without switching consoles.
- Percentile-aware time-series: Plot Init Duration at P50/P95/P99 alongside invocation count and error rate to expose correlation between cold start spikes and user-facing impact.
- Threshold and anomaly-detection alerting: Get paged on cold start frequency or init duration SLO breaches before users file tickets.
- Templated, reusable dashboards: Grafana variables let you build one dashboard that works across dozens of Lambda functions without copy-paste duplication.
Step 1: Enable Lambda Telemetry
Switch to Structured JSON Logs with Lambda Powertools
AWS Lambda Powertools (available for Python, TypeScript, Java, .NET) automatically captures cold_start: true/false per invocation and emits it as CloudWatch EMF queryable directly in Grafana's CloudWatch data source without a manual metric filter.
Node.js / TypeScript:
Python:
Create a CloudWatch Metric Filter (Without Powertools)
Navigate to CloudWatch → Log Groups → /aws/lambda/<function-name> → Metric Filters → Create filter. Use this filter pattern to extract the init duration:
Assign to custom namespace Lambda/ColdStarts, metric name InitDuration, value $init_duration. This metric only emits data points when a cold start occurs. Invocations without Init Duration in the REPORT line produce no data point, giving you clean cold-start-only data.
Enable AWS X-Ray Tracing
Enable active tracing on your Lambda function via IaC (Terraform):
X-Ray traces give you a subsegment-level breakdown of where init time is spent, which SDK client initialization, which secret retrieval call, and which database handshake data you cannot get from Init Duration alone.
Step 2: Connect Grafana to CloudWatch
In Grafana: Configuration → Data Sources → Add data source → CloudWatch. Configure with instance profile authentication (recommended) or access key credentials with least-privilege IAM.
Required IAM policy for the Grafana data source role:
Step 3: Build Your Cold Start Dashboard
Panel 1 — Cold Start Frequency Over Time
Create a time-series panel using CloudWatch Metrics. Namespace: Lambda/ColdStarts. Metric: InitDuration with SampleCount statistic — each Init Duration REPORT line = one cold start event. Layer a vertical annotation at your last deployment timestamp to immediately correlate deployment events with cold start spikes.
Panel 2 — P50 / P95 / P99 Init Duration
P99 init duration is your worst-case user experience. A P50 of 300ms and P99 of 4,200ms means 1% of your users experience 14x slower responses — average-based monitoring masks this entirely. If P99 exceeds your API latency SLO budget, cold starts are a user-facing reliability problem.
Panel 3 — Cold Start Rate (% of Total Invocations)
Calculate the fraction of invocations that triggered a cold start. Expression: (SampleCount of InitDuration) / (Sum of Invocations) * 100. A cold start rate above 5% for steady-state traffic is worth investigating. Above 10% indicates inadequate concurrency configuration or insufficient provisioned concurrency for your traffic pattern.
Panel 4 — Cold Starts by Runtime
If you manage mixed-runtime fleets, query CloudWatch Logs Insights:
This query immediately surfaces which runtimes drive the most cold start latency. Java runtimes almost always appear at the top, often 5–10x the init duration of Node.js or Python equivalents, creating an objective, data-backed case for runtime migration decisions.
Panel 5 — Cold Starts vs. Error Rate Correlation
Overlay Errors from AWS/Lambda on the same timeline as cold start frequency. If your error rate spikes 30–60 seconds after a cold start surge, you have cold-start-induced connection failures, database connections, downstream dependency timeouts, or SDK initialization failures.
Step 4: Set Up Alerting
Define Grafana alert rules that fire before users notice:
Alert 1 — Cold Start Spike:
Alert 2 — P99 Init Duration SLO Breach:
Alert 3 — Cold Start Rate Threshold:
Step 5: Diagnose Root Causes
Pattern: Cold Starts Only After Deployments
Consistent cold start spikes 2–5 minutes after a deployment that then decay are normal Lambda warm-up behavior your warm container pool is replaced with new versions. Solutions:
- Provisioned Concurrency: Pre-warms a defined number of execution environments. Calculate whether MTTR cost ($300–$500/hour for P1 incidents) justifies the provisioned concurrency spend for latency-sensitive functions; it almost always does.
- Lambda SnapStart (Java 11+ only): Captures a snapshot of the initialized execution environment after your init code runs, then restores from snapshot on cold start. Eliminates JVM initialization penalty entirely.

Pattern: Cold Starts Correlate with Traffic Valleys
Inactivity-driven cold starts at 3 am UTC or post-weekend periods. Solutions:
- Scheduled warm-up pings: EventBridge rule triggering a lightweight WARM event every 5 minutes. Cost: ~$0.20/month per function. Negligible.
- Provisioned Concurrency with Auto Scaling: Scale provisioned concurrency up before predicted traffic increases using scheduled scaling actions tied to your traffic pattern.
Pattern: High P99 vs. P50 Variance (5–10x Delta)
High variance signals non-deterministic initialization latency from network calls in global scope. Fix: lazy initialization with module-scoped caching:
Pattern: VPC Functions with 10x Cold Starts vs. Non-VPC
Verify Hyperplane ENI is active. Check IAM role includes:ec2:CreateNetworkInterface, ec2:DescribeNetworkInterfaces, ec2:DeleteNetworkInterface. Most importantly: check subnet CIDR block IP availability — exhausted IP pools silently delay ENI provisioning by 10–30 seconds, and this failure mode is invisible in Lambda logs.
The Compliance Dimension: Lambda Audit Trails
Cold start debugging is not just a latency problem — it is a compliance surface. Every Lambda invocation that fails during cold start initialization creates a gap in your audit trail. If you are subject to SOC 2, PCI-DSS, or HIPAA requirements, you need structured log retention, IAM role change tracking, and immutable evidence of who modified function configuration and when.
Your Grafana cold start dashboard should correlate cold start spikes with IAM role ARN changes and function configuration modifications pulled from AWS CloudTrail. A cold start regression that follows an UpdateFunctionConfiguration API call, changing memory from 1,024MB to 512MB, is both a performance incident and a change management audit event. Without this correlation in your observability stack, you produce separate compliance artifacts and operational dashboards that cannot speak to each other.
Key Takeaways
- Cold starts are measurable and expensive: Enable structured JSON logging with Lambda Powertools or CloudWatch metric filters. A senior SRE spending 4+ hours/week on cold start triage is $26K+/year in toil — before customer impact.
- Build for percentiles, not averages: P99 init duration is what your slowest users experience. If P99 exceeds your API latency SLO, cold starts are a user-facing reliability issue that average-based monitoring will never surface.
- Correlate across context: Cold start spikes mean different things post-deployment, traffic valley, VPC misconfiguration, or initialization code latency. Your dashboard should make the distinction obvious before your on-call engineer picks up the pager.
- Close the compliance loop: Correlate Grafana performance signals with CloudTrail IAM and configuration changes. Every cold start regression is a change management event as much as a performance event.
- Automate the RCA step: Grafana shows you what is happening. AI-assisted observability tells you why and what to do next, compressing 90 minutes of RCA archaeology into seconds and reducing MTTR by 40–55%.
Ready to connect your Grafana observability stack to an AI agent that automatically triages Lambda cold start alerts, correlates them with deployment history, and surfaces remediation steps before your on-call engineer has opened Slack? Schedule a demo with StackGen and see how Aiden turns cold start visibility into proactive reliability.
Want to see the full platform? Visit the StackGen Platform Overview to see how Aiden connects observability, incident management, and infrastructure automation in a single SRE workflow.
