

Share This:
Introduction
It’s 2:47 AM. A P1 alert fires. Your on-call SRE opens their laptop, pulls up five dashboards, scans through hundreds of log lines, and spends the next 90 minutes just trying to figure out what is broken before even starting to fix it.
This is the infrastructure remediation reality for most engineering teams today. Mean time to detect is decent. Mean time to resolve is a disaster. The gap between “we know something’s wrong” and “we’ve fixed it” is where hours get lost, customer trust erodes, and SREs burn out.
AI SREs are changing that equation. In this post, we’ll break down exactly how AI-powered remediation works from signal correlation to autonomous fix execution and how your team can implement it without ripping out your existing stack.
Why Traditional Infrastructure Remediation Breaks Down
Before understanding the solution, it’s worth being precise about where the current model fails.
The Alert Noise Problem
The average engineering team running a modern microservices architecture generates 400+ alerts per day. Maybe 10 are actionable. The rest are symptoms, correlations, or outright noise. When your SREs spend more time triaging alerts than resolving incidents, you’ve built a system that trains people to ignore alerts.
Every new microservice adds 15–20 new alert rules. Nobody removes the old ones. Before long, Alertmanager is deduplicating the same underlying issue across 30 different alert labels, and the engineer on call has no idea which one to start with.
The Context Fragmentation Problem
By the time a real incident is confirmed, the investigation context is spread across:
- Prometheus metrics showing resource pressure
- Grafana dashboards with manual annotations
- Loki or Elasticsearch log streams
- Kubernetes event logs with OOM kills and pod restarts
- Slack threads from the last three similar incidents
- A Confluence runbook that hasn’t been updated since the architecture changed
Root cause analysis in this environment is archaeology, not engineering. You’re reconstructing a timeline from fragments, under pressure, at 3 AM. Even experienced SREs take 60–90 minutes to establish causality.
The Runbook Execution Problem
Most teams have runbooks. Most runbooks are outdated. Engineers working a live incident hesitate to run automated remediation steps they don’t fully trust and that hesitation is rational when the runbook last ran against a different version of the infrastructure.
The result: every remediation is partially manual. A human is always in the loop, not because their judgment adds value at every step, but because nobody trusts the automation.
There’s a compounding cost here that rarely shows up in incident postmortems: on-call chaos is the leading reason senior SREs leave teams. Replacing one is a $50K+ recruiting event, not counting the six months of institutional knowledge that walks out the door with them.
What AI-Powered Remediation Actually Does
 AI SREs don’t replace human judgment; they eliminate the low-value work that sits in front of it. Here’s the functional breakdown.
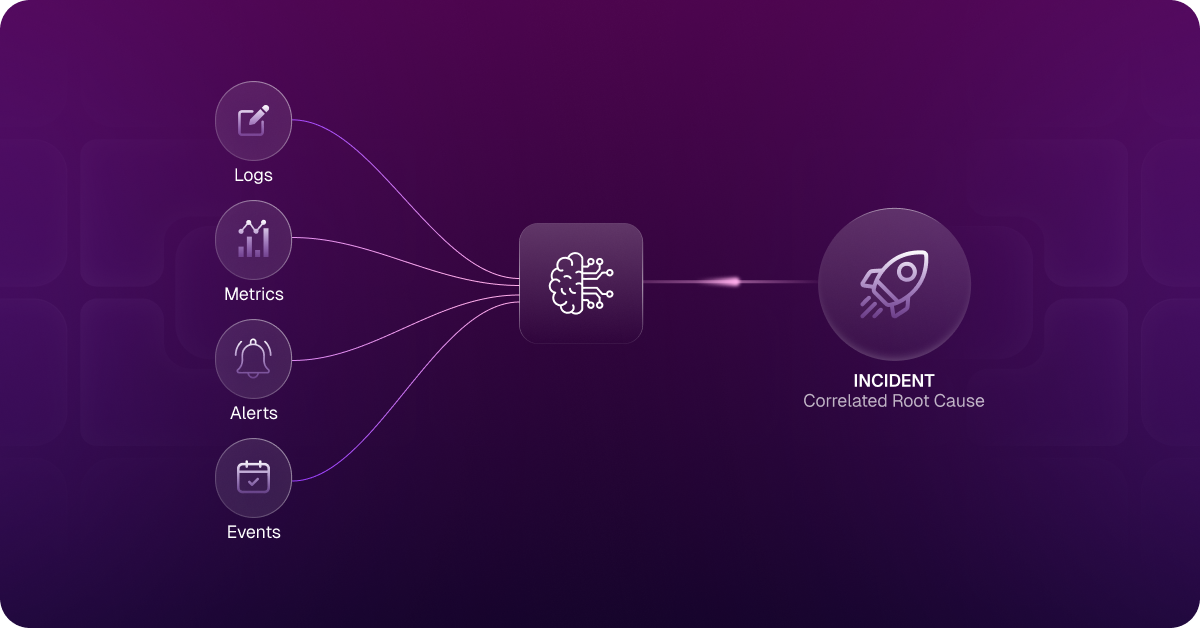
1. Signal Correlation at Machine Speed
When an HPA misconfiguration causes cascading resource contention across a Kubernetes namespace, the alert storm looks like 40+ individual Alertmanager events, CPU throttling on 3 pods, OOM kills on dependent services, a latency spike on the upstream API, downstream error rate crossing SLO thresholds, each appearing to be a separate issue.
An AI SRE correlates these signals in seconds. It recognizes that the throttling, OOM kills, and latency spike share a common root cause, not because someone wrote a rule, but because it has learned the dependency graph of your infrastructure and the failure modes that produce these co-occurring signals. The storm collapses into one incident with one root cause hypothesis.
2. Automated Context Assembly
Before a human ever joins the incident bridge, the AI SRE has already assembled:
- The relevant Prometheus metric timeseries (with anomaly windows highlighted)
- The correlated log streams from affected pods, filtered to error-level events
- The Kubernetes event timeline showing pod evictions, restarts, and scaling events
- Links to previous similar incidents and how they were resolved
- A plain-language summary of what’s failing, why, and what it’s affecting
What used to take 60–90 minutes of manual investigation arrives in the first 60 seconds. Your SRE joins the incident already knowing the blast radius and the most likely fix.
3. Remediation Execution with Guardrails
This is where AI SREs move from diagnosis to action. Depending on your configuration, the system can:
Automatically execute low-risk remediations:
- Restarting pods with persistent memory leaks
- Scaling deployments when resource limits are the root cause
- Rotating credentials when authentication failures match known rotation patterns
- Clearing stuck Terraform state locks after validating no concurrent apply is running
Propose high-confidence remediations for human approval:
- IAM role policy changes that resolve permission errors
- Adjusting Kubernetes resource limits based on observed usage patterns
- Routing table changes to resolve network connectivity issues
The key distinction from traditional runbook automation: the AI SRE doesn’t just execute pre-written scripts. It understands the infrastructure state, selects the appropriate remediation action, and applies it with contextual awareness of what’s running in the environment right now.
4. Proactive Incident Prevention
Most AI SRE tooling focuses on faster response. The more important capability is earlier detection, catching the precursor signal before it becomes a page.
Aiden surfaces anomaly patterns in Prometheus metric behavior before they cross alert thresholds: a memory growth trend that will trigger an OOM kill in four hours, a pod restart rate that historically precedes a cascade failure, an HPA that’s been ceiling-capped for 48 hours and is absorbing traffic it shouldn’t. These aren’t alerts—they’re early warnings. Your SRE can take a deliberate action during business hours instead of running an emergency fix at 2 AM.
5. Post-Incident Learning
Every incident the AI SRE handles becomes training data. Fix a novel issue manually, and the system learns from it. The runbook base evolves automatically. Over time, the class of incidents requiring human intervention narrows—not because you ripped out manual oversight, but because the system accumulates institutional knowledge that doesn’t live in someone’s head or in a stale Confluence doc.
How Aiden AI Agent Implements This in Practice
StackGen’s Aiden is an AI SRE built for production infrastructure teams. It integrates directly with your existing observability stack—Prometheus, Grafana, Alertmanager, PagerDuty, OpsGenie—and operates across your Kubernetes clusters, cloud accounts, and IaC pipelines.
Step 1: Detection and Correlation
Aiden monitors your Prometheus alert stream and Kubernetes event logs continuously. When it detects a correlated failure pattern, say, a deployment rollout degrading service health, it groups the related alerts into a single incident context, identifies the deployment as the probable change event, checks the affected service’s SLO status, and pulls relevant logs from the past 15 minutes. This happens before anyone gets paged.
Step 2: Intelligent Triage
The SRE who gets paged receives an incident summary that includes:
- What’s failing (service name, error rate, affected endpoints)
- Why it’s likely failing (the deployment event + correlated metric shift)
- What’s at risk (SLO burn rate, downstream services affected)
- Recommended next steps (ranked by confidence)
Instead of opening five tools and spending an hour building this picture manually, the SRE arrives at the “what do we do” question in under two minutes.
Step 3: Remediation Action
For a degraded deployment, Aiden’s recommended remediation might be a rollback to the previous stable version, with a 94% confidence score based on the last similar incident 12 days ago, estimated resolution time 3 minutes. The SRE reviews the recommendation, confirms, and approves. Aiden executes, monitors the rollout, and confirms resolution.
For known-safe remediations (restarting pods with OOM patterns that match a well-established fix), Aiden can be configured to execute autonomously within policy-defined boundaries.
Step 4: SOC 2-Ready Audit Trail
Every action Aiden takes, every metric queried, every remediation proposed, every command executed is logged with full context: who approved it, what the system state was, what the outcome was. For teams with SOC 2 compliance requirements, this audit trail satisfies the change management controls that manual incident response often fails to produce consistently. You get a machine-generated incident timeline that’s accurate, complete, and available immediately after the incident closes.
Step 5: Continuous Learning
After each incident, Aiden updates its model of your infrastructure. If a fix worked, it increases confidence in that remediation for similar future incidents. If it didn’t, it captures what the secondary root cause turned out to be. Over three to six months, teams typically see MTTR drop 40–60% as Aiden accumulates institutional knowledge about their specific infrastructure topology.
Integration with Your Observability Stack
One of the most common objections to AI SRE tooling is the integration tax. If adopting AI remediation means ripping out your Grafana dashboards or replacing PagerDuty, the switching cost will exceed the benefit—and most teams know it.
Aiden is designed for integration, not replacement. It reads your Prometheus alert stream and Alertmanager routing rules, correlates log context from Loki or Elasticsearch, pulls Kubernetes event data via cluster API, and routes incidents through your existing PagerDuty or OpsGenie workflow. Your on-call runbook, your escalation policy, your dashboards none of that changes. What changes is what your SRE sees when they open the incident.
For cloud context, Aiden integrates with AWS, GCP, and Azure to understand resource state alongside your observability signals, so when a Lambda timeout correlates with an RDS connection pool exhaustion, it sees both sides of the failure.
StackGen’s ObserveNow extends this further. If your team is running self-hosted Prometheus and Grafana, ObserveNow provides a managed observability layer that gives Aiden deeper signal access without requiring you to operate the monitoring infrastructure yourself. For teams dealing with observability costs growing 2–3× faster than infrastructure spend, ObserveNow addresses the cost side of the equation at the same time.
Measuring the Impact
Infrastructure remediation ROI is measurable in concrete terms. After three months with Aiden, teams typically report:
- 40–60% reduction in MTTR for incidents within the system’s coverage area
- 70%+ reduction in investigation time for correlated multi-signal incidents
- 30–50% reduction in alert-to-page volume through intelligent deduplication
- 10–15 hours/week recovered per SRE that shifts from toil to proactive work
 One Series B fintech team running microservices on EKS cut their median P1 resolution time from 3.5 hours to under 40 minutes within the first 90 days—without changing their underlying Prometheus and Grafana setup. The primary driver wasn’t faster execution; it was eliminating the 60–75 minutes they’d been spending on manual context assembly before every incident bridge.
Getting Started
The fastest path to AI-powered remediation is not a wholesale infrastructure overhaul; it’s starting with a focused use case. Pick your three most frequent P2/P3 incident types from the last 90 days. Configure Aiden to handle these first. Measure MTTR before and after. Use that data to justify expanding the scope.
For platform engineering teams, Aiden for Platform Engineering extends AI remediation to IaC pipelines and internal developer platforms. For infrastructure-focused teams, Aiden for Infrastructure provides the managed layer that reduces self-hosting overhead while giving Aiden deeper integration access.
Ready to see how Aiden handles your specific incident types? Schedule a demo, and we’ll walk through your current stack and show you exactly what automated remediation looks like in your environment.
Conclusion
Infrastructure remediation doesn’t have to be a 2 AM archaeology project. The technology to automate signal correlation, context assembly, and fix execution exists today, and it integrates with the observability stack you already have.
The teams that deploy AI SREs aren’t eliminating their SRE function. They’re elevating it. Less firefighting, more reliability engineering. Less 3 AM alert triaging, more proactive SLO refinement and capacity planning. That’s the outcome AI-powered remediation delivers when it’s implemented with the right scope and the right tooling.
The question isn’t whether AI SREs will become standard practice. It’s whether your team adopts them before or after the next preventable P1 outage.
