

Share This:
For SRE and platform engineering teams seeing observability bills grow with every new service, this post covers the four cost levers that work, how managed OSS stacks compare to proprietary platforms, and where AI agents change the economics.
TL;DR
- Managed open source observability (Prometheus, Grafana, Loki, Tempo) eliminates per-host and per-user pricing, the primary driver of cost growth in proprietary platforms.
- Filtering telemetry at the OTel Collector layer before it reaches storage can cut log and trace costs by 50–70% without changing application code.
- Tail-based trace sampling, cardinality audits, and tiered retention policies are the three highest-ROI configuration changes for most teams.
Why Do Observability Costs Keep Growing?
For most teams, the bill grows as the infrastructure grows. A few new microservices are deployed. Another Kubernetes cluster is added. More teams start instrumenting applications. Every change generates more telemetry, and because most commercial platforms price based on usage, the bill increases alongside it.
Around 70% of organizations say they want to optimize their existing spend without losing visibility. To do that, you first need to understand where the money goes.
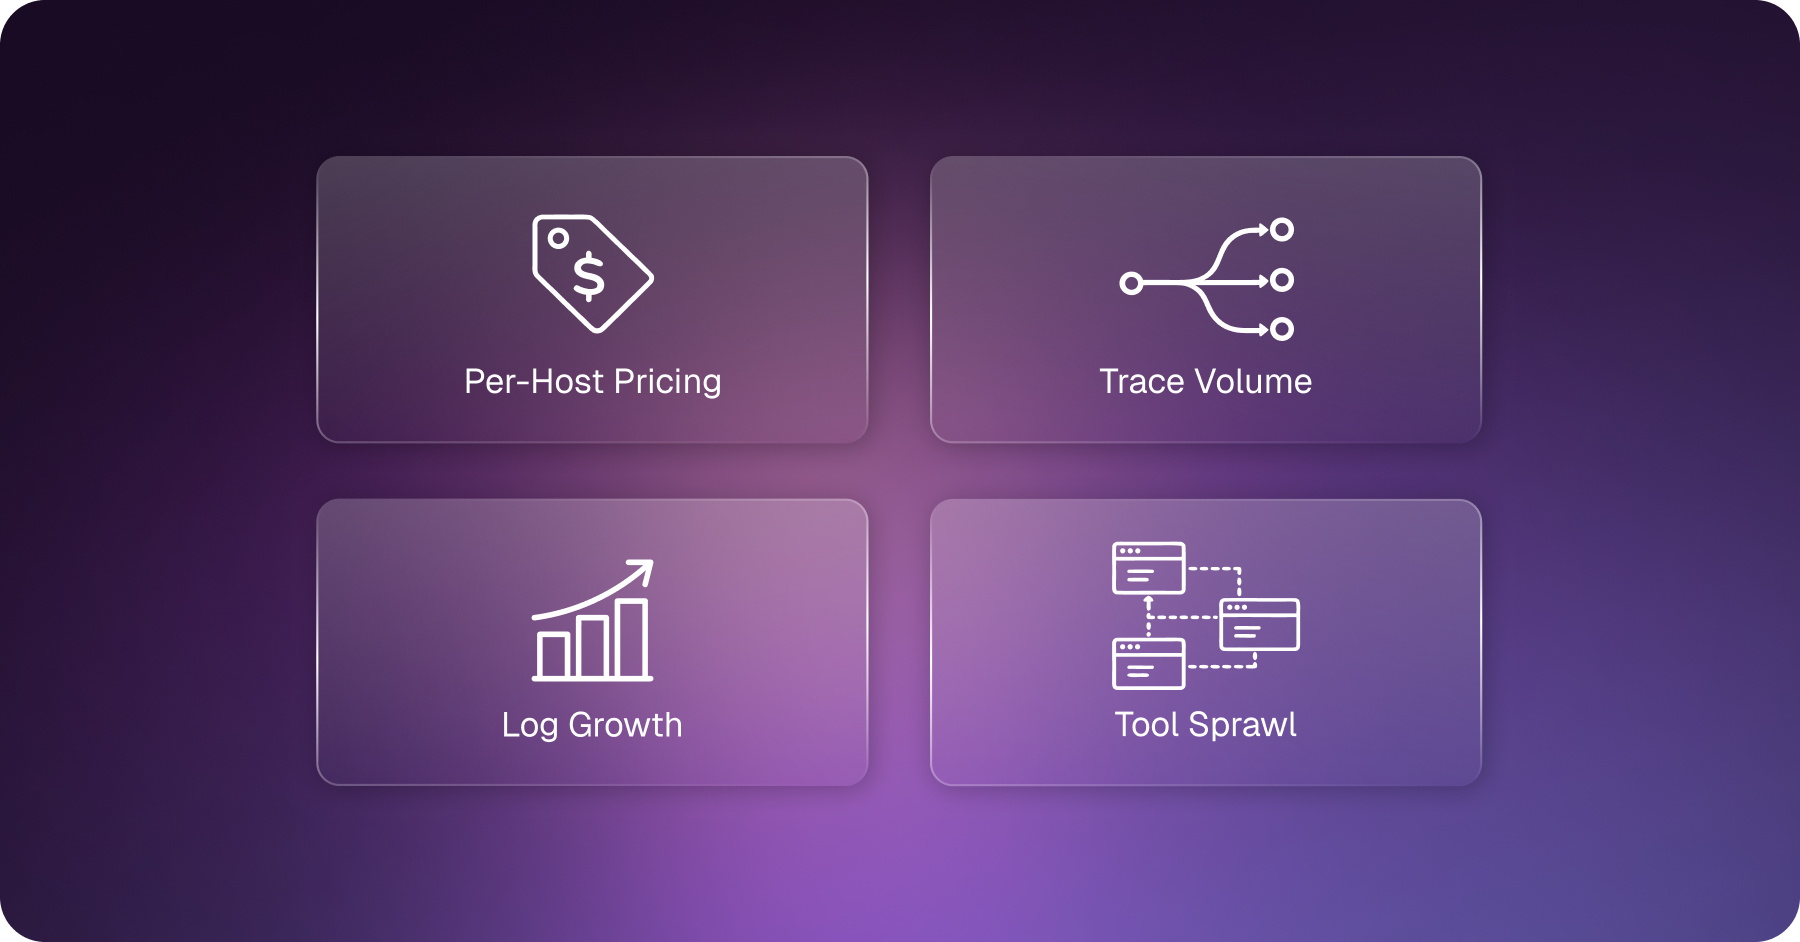
The biggest contributors are usually:
- Usage-based pricing: Most proprietary platforms charge per host, per GB of data ingested, or per user. As they say, the more you grow, the more you pay; those costs increase automatically. A 100-host environment running infrastructure monitoring and APM can spend tens of thousands of dollars each year before logs or custom metrics are even included.
- Trace volume: In modern microservices architectures, traces often account for 60–70% of observability costs. Every request moving between services generates multiple spans, and if trace sampling isn't tuned, costs can grow much faster than expected.
- Log growth: Production systems generate large volumes of logs that simply confirm everything is working normally. Ingesting, indexing, and retaining all of that data, especially in hot storage, adds up quickly. Wakefield Research found that 98% of organizations experience unexpected observability cost spikes, often after product launches or configuration errors that suddenly increase log volume.
- Tool sprawl: Many teams use separate platforms for metrics, logs, traces, alerting, and incident management. Each tool brings another subscription, another integration to maintain, and another interface engineers have to switch between during an incident.
And there's another cost that doesn't appear on a vendor invoice: engineering time. If you're running a self-managed observability stack, engineers are also spending time managing Prometheus storage, tuning Alertmanager, maintaining federation, planning upgrades, and troubleshooting the platform itself.
That engineering effort is easy to overlook, but it's part of the total cost of ownership just as much as compute, storage, or licensing. This is one of the costs Aiden for Observability is designed to claw back, by automating the investigation work that engineers currently do by hand.
How Do You Reduce Observability Costs
The four highest-impact cost levers are OTel Collector filtering, cardinality control, tiered retention policies, and tool consolidation, applied in that order for the fastest ROI.
Cost reduction in observability comes down to what data enters storage and how long it stays there. These four levers cover the areas where the biggest gains tend to be.
Filter Observability Data Before It Reaches Storage
The OTel Collector sits between your services and your backends and can drop, sample, and route telemetry before any vendor charges for ingestion.
The two highest-value filters to configure first:
Drop health check logs and low-severity traces. Most production systems emit continuous health check traffic that has zero diagnostic value. Dropping it at the Collector costs nothing operationally and reduces ingest volume significantly.
Aiden for Observability can surface which filters and sampling rates apply to your specific traffic patterns, rather than guessing at thresholds.
Apply tail-based sampling on successful request traces. Head-based sampling decides at trace start using limited information. Tail-based sampling waits until a trace is complete, meaning you can retain 100% of error traces and high-latency outliers while sampling down routine successful requests to 1–10%.
Control Metric Cardinality in Prometheus
Start with an audit of your top 20 most expensive metrics. Check which label dimensions are actually queried in dashboards and alerts, and drop the rest at the Collector layer before they reach Prometheus.
Treat cardinality as a continuous audit rather than a one-time cleanup. Kubernetes environments add new label dimensions constantly through pod names, node names, and deployment IDs. Without a standing process, cardinality creep resumes within weeks of any cleanup.
Set Retention Policy for Observability Data
Retention policies default to a single window across most platforms, which means operational logs and compliance archives sit in the same hot storage tier regardless of how often each is actually queried. Hot storage is expensive.
A practical tiering model:
- Hot (30 days): Operational logs and recent metrics. This is what the on-call engineer needs during an active incident.
- Warm (90 days): Aggregated metrics and sampled logs. Enough for trend analysis and post-mortems on longer-running issues.
- Cold (1 year+): Compliance logs and audit trails routed to object storage (S3 or GCS). Query latency is higher, but storage cost is a fraction of the hot tier.
For most engineering teams, 30 days of detailed logs and 90 days of metrics cover the vast majority of incident investigations.
Tool Consolidation
Every additional vendor contract adds per-seat costs and integration maintenance. One platform for metrics, logs, traces, incidents, and alerting is structurally more cost-efficient than six separate ones, even if per-feature pricing looks similar on paper.
What Does Managed Open Source Observability Solve?
Managed open source observability solves the operational overhead of running Prometheus, Loki, and Grafana at scale: you keep the OSS tooling and portability, while the infrastructure management becomes the vendor's problem.
The open-source observability stack, including Prometheus, Grafana, Loki, Tempo, and OpenTelemetry, has been the answer to vendor lock-in for years. The problem was operational overhead. Running Prometheus at scale means federation, Thanos or Mimir for long-term storage, Alertmanager tuning, and upgrade cycles that tend to surface issues at inconvenient times.
Managed OSS handles the infrastructure layer without changing the stack.
Cost structure: OSS backends don't charge per host or per user. Loki stores significantly less than Elasticsearch by indexing only metadata labels, not full log content, which is why log-heavy workloads see the largest cost reductions when migrating. Paytm Insider saved 75% on logging costs after migrating to Loki.
No re-instrumentation: Existing Grafana dashboards, Prometheus recording rules, and alert configurations carry forward. Years of institutional knowledge don't need to be rebuilt.
Portability: OpenTelemetry has reached 49% production use across CNCF member organizations, with another 26% evaluating it, as organizations standardize on it for vendor-neutral telemetry collection. Switching backends requires changing Collector configuration, not application code. That is important when pricing changes.
If you're looking to reduce the operational overhead of self-managing observability, Aiden for Observability gives you a managed Grafana, Prometheus, Loki, and Jaeger stack with more than 300 integrations built on OpenTelemetry standards.
Reduce Your Observability Costs with Aiden
A managed open source observability stack reduces infrastructure and licensing costs, but it doesn't eliminate the work involved in investigating incidents. When an alert fires, you still need to collect enough context to decide whether it's actionable and what to do next.
That investigation typically involves answering a few questions:
- What changed? Was there a deployment, configuration change, or infrastructure event before the alert?
- What's affected? Is the issue isolated to one service, or is it propagating across dependencies?
- What do the signals say? Do the metrics, logs, and traces point to the same failure, or are they telling different stories?
- Has this happened before? Are there previous incidents, runbooks, or known remediation steps that apply?
Finding those answers often means moving across multiple dashboards and querying different data sources before you can begin remediation.
Aiden for Observability performs that investigation for you. It analyzes the alert, queries your observability data, correlates the relevant signals, and presents a root cause analysis with the supporting evidence. If you've defined remediation policies, it can also execute approved actions or recommend the next steps for review.
For example, StackGen's SRE team received a Kubernetes Node Not Ready alert. Aiden verified that the node had already been replaced by the autoscaler, so no manual kubectl investigation was required.
greytHR saw a similar operational improvement after adopting ObserveNow and Aiden. Engineers could investigate incidents from a single interface with correlated metrics, logs, and traces instead of switching between cluster-specific dashboards across AWS and GCP.
The result was a 90% reduction in observability support tickets, with detection times down 45–55% and resolution times down 55–65%.
Book some time with our team or get started for free today!
FAQs
What is managed open source observability?
Managed open source observability is a hosting model where vendors operate the OSS stack (Prometheus, Grafana, Loki, Tempo) as a service. You get the portability and pricing model of open source without the operational burden of running it yourself.
How much can you save by switching from Datadog to an OSS stack?
Savings vary by workload, but teams migrating from per-host or per-GB proprietary pricing typically report 40–70% lower total cost. Log-heavy workloads migrating from Elasticsearch to Loki tend to see the largest reductions, since Loki indexes only metadata labels rather than full log content.
Does switching to open source observability require re-instrumentation?
No. If you're using OpenTelemetry instrumentation, switching backends is primarily an OTel Collector configuration change, not an application code change.
What is tail-based sampling, and why does it reduce costs?
Tail-based sampling waits until a trace is complete before deciding whether to retain it. This lets you keep 100% of error and high-latency traces while sampling down routine successful requests to 1–5%, versus head-based sampling, which makes the decision at trace start without that context.
Can Aiden help reduce observability costs directly, or only MTTR?
A: Both. Aiden for Observability reduces MTTR by 60–80%, and on top of that, it reduces observability tooling costs by 45% compared to traditional APM — even when layered on an existing stack. The savings come from cutting the manual investigation time engineers spend correlating metrics, logs, and traces during every incident, not just from faster resolution.
How does Aiden for Observability work with existing tools?
Aiden sits on top of your existing observability stack (ObserveNow,, Grafana, Datadog, or New Relic) and automates cross-signal correlation without requiring re-instrumentation or proprietary data lock-in.
